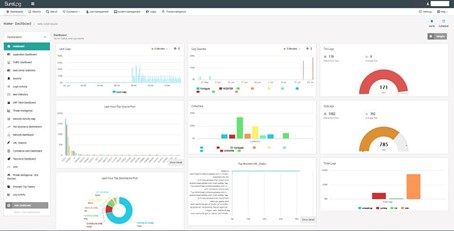
The SureLog application features dashboards on various security topics. Dashboards deliver monitoring and reporting metrics to track the state of security throughout the network. These are simple to configure and user friendly, while allowing users to read a summary of existing network infrastructure data using graphs and tables.
The following tasks can be accomplished in the Dashboard portal:
· Adding a Dashboard Panel
· Creating a New Dashboard
· Editing a Dashboard
· Deleting a Dashboard
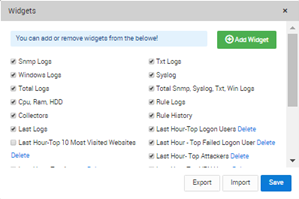
· Selecting a Widget*
• Widgets: Use the Widgets button to add more Widgets to the Dashboard’s panel.
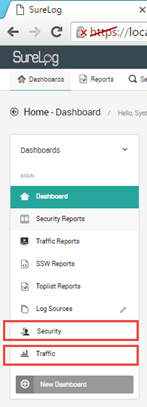
*We can add more than one Dashboard Panels for each user such as Security and Traffic as shown in the figure below.
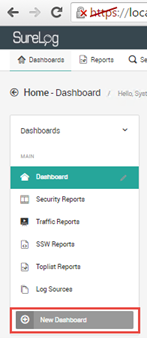
To create dashboard:
• Click New Dashboard button
• Enter a name for the dashboard, you can chose icon from the list.
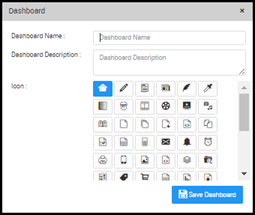
• Click Save Dashboard button to save the dashboard.
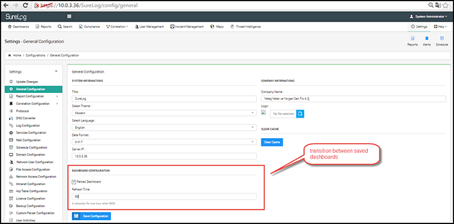
Transition Between Dashboard
You can transition between dashboards refresh value set 60 second
as shown in the following figures
*The users can add Statistics Reports, Top lists Reports, Trend Reports, SQL Query and SQL Query(Graphic) as widget on Dashboard as shown in the following figures:
To add a Statistic Report on Dashboard
1. Select Dashboard
2. Select Widgets button
3. Select Add Widget button
4. Select Statistic Reports
5. Enter the following configurations into the appropriate fields:
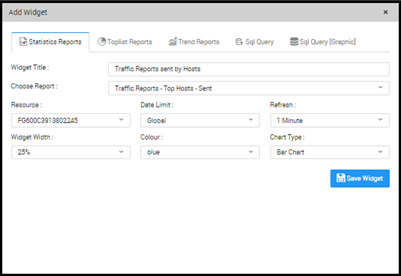
6. Click Save to save the configuration.
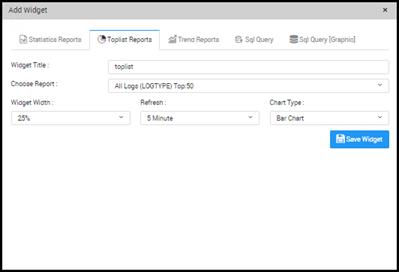
To add a Top list Report on Dashboard:
1. Select Dashboard
2. Select Widgets button
3. Select Add Widget button
4. Select Top list Reports
5. Enter the following configurations into the appropriate fields:
6. Click Save to save the configuration.
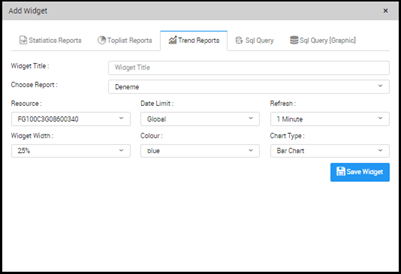
To add a Trend Report on Dashboard:
1. Select Dashboard
2. Select Widgets button
3. Select Add Widget button
4. Select Trend Reports
5. Enter the following configurations into the appropriate fields:
6. Click Save to save the configuration.
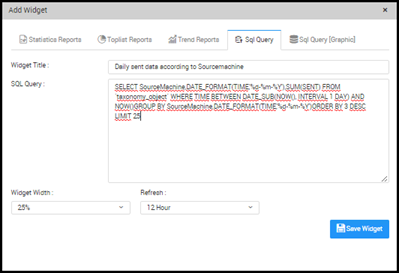
To add a SQL Query Report on Dashboard:
1. Select Dashboard
2. Select Widgets button
3. Select Add Widget button
4. Select SQL Query Reports
5. Enter the following configurations into the appropriate fields:
6. Click Save to save the configuration.
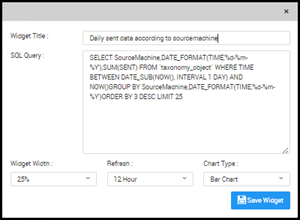
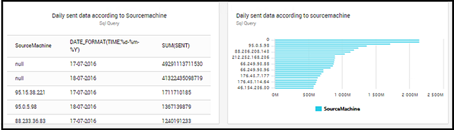
To add a SQL Query (Graphic) Report on Dashboard:
1. Select Dashboard
2. Select Widgets button
3. Select Add Widget button
4. Select SQL Query (Graphic) Reports
5. Enter the following configurations into the appropriate fields:
6. Click Save to save the configuration.
The widgets are shown below;
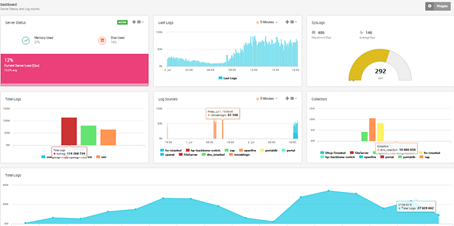
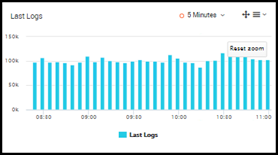
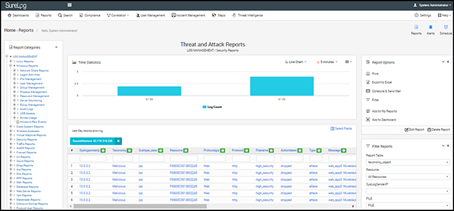
Last Logs
You can follow last log volume from dashboard;
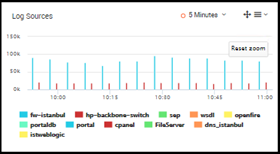
Log Sources
You can follow log sources from dashboard;
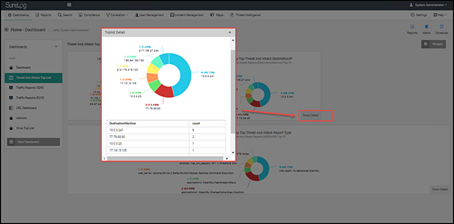
Drill –Down Feature
If you click on charts you move from one place to another, information to detailed data by focusing in on details. Each chart has this property.
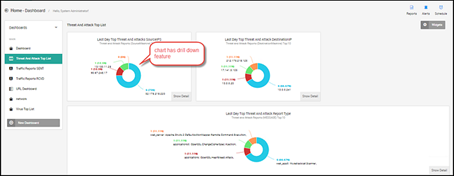
Also you can find details by clicking the Show details shown below;
Adding a Dashboard Panel
SureLog provides users with the flexibility to instantly add a panel to the current dashboard layout. The dashboard layout is logically divided into Top and Bottom sections.
1. In the New Dashboard Widget panel, select any widget from list, drag and drop the selected panel into the Set Dashboard Layout section. The selected report/monitor is added to the dashboard panel.